

Market Update
December 2024
I hope you had a lovely Thanksgiving and have a lot to look forward to this month.
We are overdue for a market update. Last time I shared these numbers we only had 2024 data for January through March. A lot has happened since the spring, and we are now able to get a sense of whether those changes have impacted home sales in Northern Virginia.
Please note both charts represent all residentials sales (condos, townhomes, single family) among Northern Virginia (Arlington, Alexandria, Fairfax, Loudoun, and Prince William Counties and their jurisdictions). The first chart indicates the median final sale price per month. As noted in the past, it does not reflect is the variance between the original list price, contract price, final sale price, or concessions. All important considerations when pricing your home or making an offer. The chart simply reflects whether final sale prices throughout our region are higher or lower than prior months and years.
As you can see, prices in 2024 have remained higher than the two previous years. Home prices dipped a little in May compared to last year when they increased. There was also a spike in June which debunks the myth of a spring market. July and August’s median sale prices are only slightly lower than May’s.
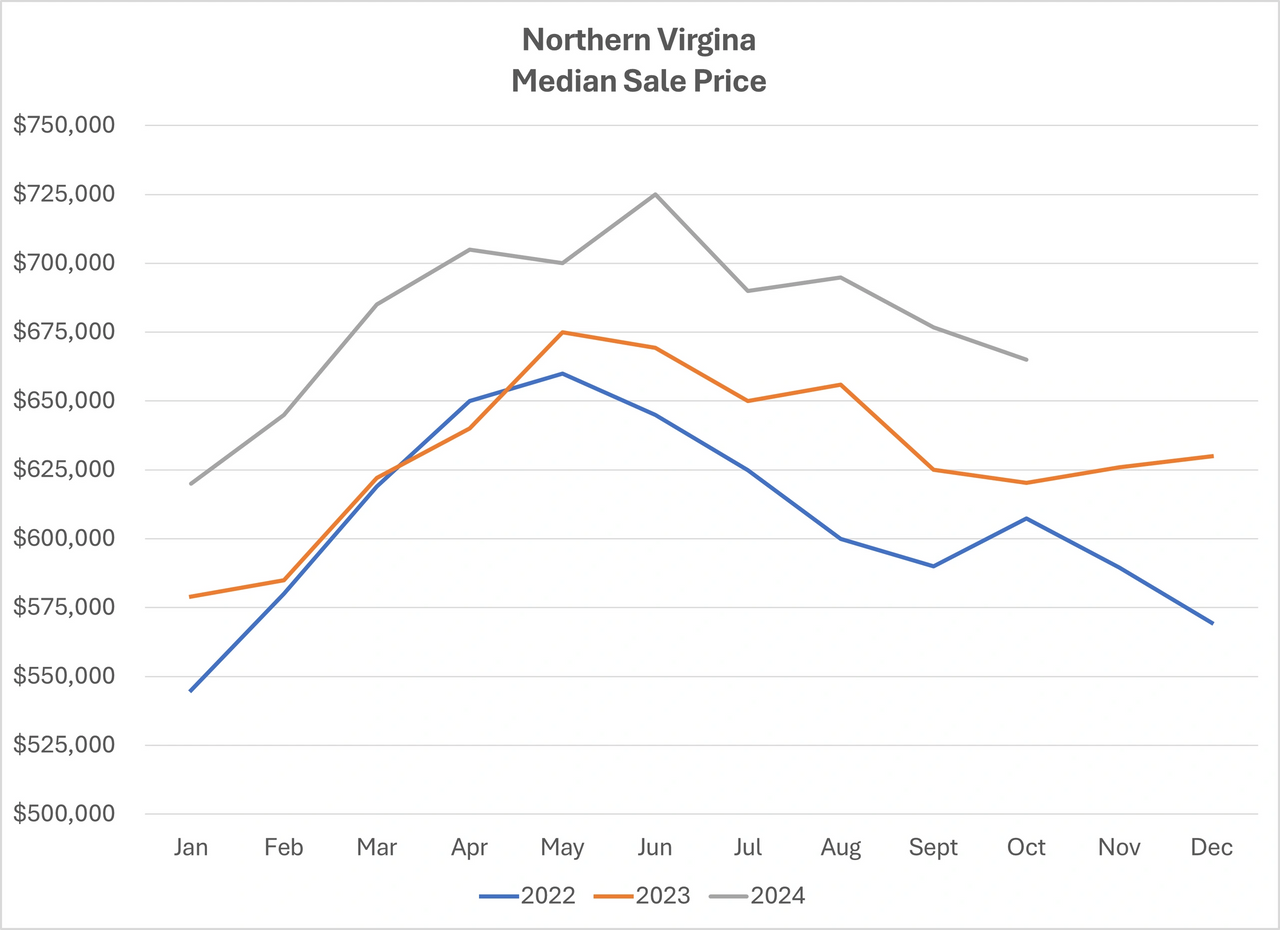
It is difficult to discern how many closings since August were under contract prior to the changes due to the National Association of Realtors (NAR) lawsuit. Regardless, the prices in recent months are still higher than the fall of 2022 and 2023. Some predicted the prices would decrease as interest rates increased. Again, that assumption was not accurate for Northern Virginia.
Many buyers are waiting for “the crash.” Check out the Two Reasons Why the Housing Market Won’t Crash blog to find out why a crash is not likely. Others are waiting for the interest rates to decrease, yet there is no prediction of another historical event. While current rates seem high compared to previous years, they are still below the historical average. Lastly, if you are saving for your down payment consider the continuous increase in prices. For instance, 20% for the average home price now will not equate to 20% in the future. Unless the amount of savings and the return can outpace inflation, reaching the goal is exceptionally difficult.
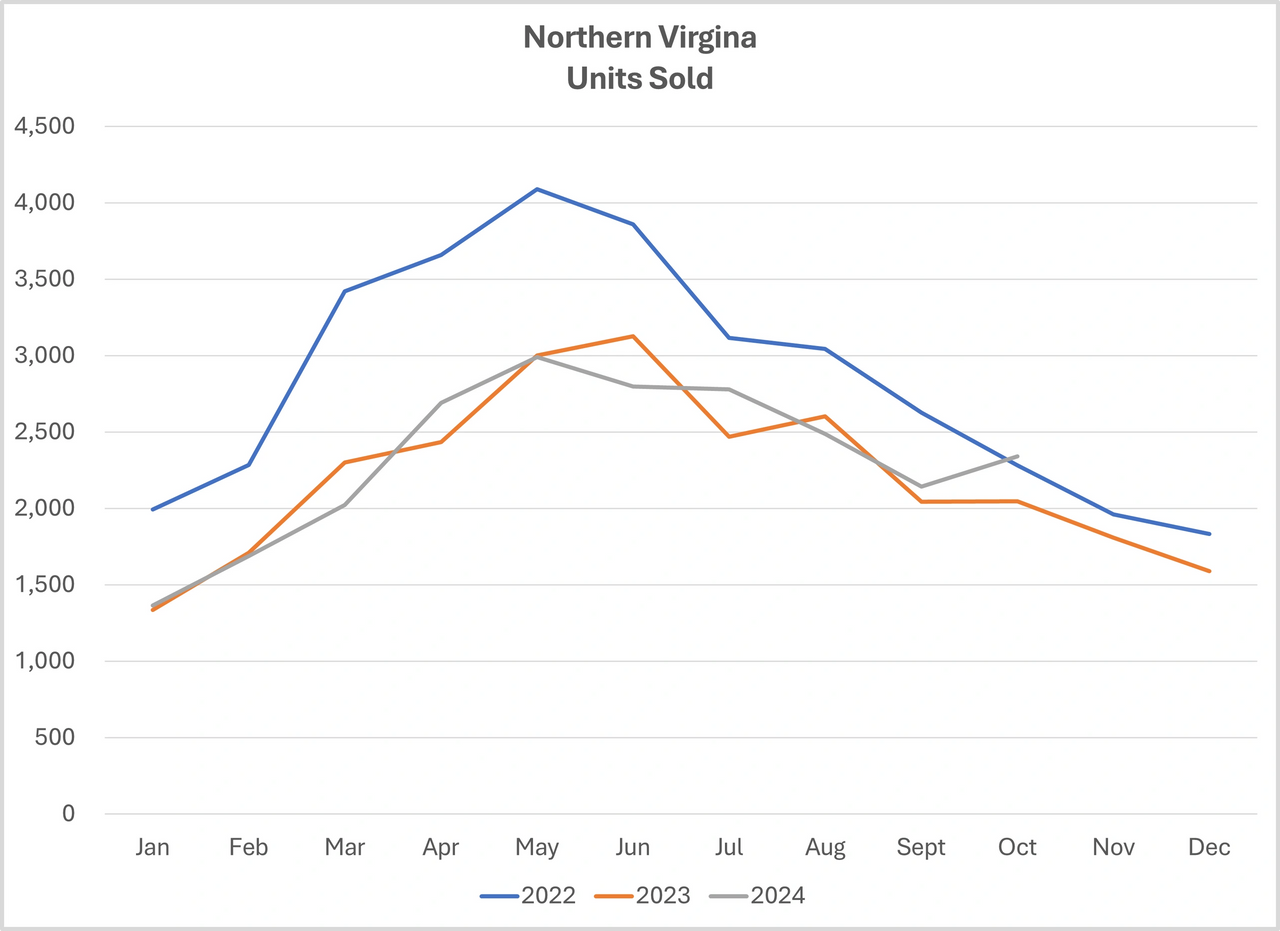
What I find interesting about the next chart is the number of homes sold in October is slightly less than last year, yet the median sale price is approximately $45,000 more. Also, May had the highest number of sales but not the highest price point.
The best time to sell is highly dependent on multiple factors. It is important to keep in mind the time it takes to prepare your home for a smooth process. Most of these sales were under contract 30-45 days prior to closing. Prior to being under contract, they were active on the market for a few days to many weeks. If you plan to sell in the spring, now is the time to begin the process.
I find these charts useful to get a sense for trends, although they are not a substitute for hyper-local data. Every sale and purchase is as unique as the people I get to represent. I would love to know your thoughts! Drop me a line to continue the discussion or if you would like data for your neighborhood.
From my family to you and yours, I wish you the best this season offers!
