

Market Update
May 2024
I hope your spring is off to beautiful new beginnings! Godspeed to my teacher friends and parents of littles these last few months of school.
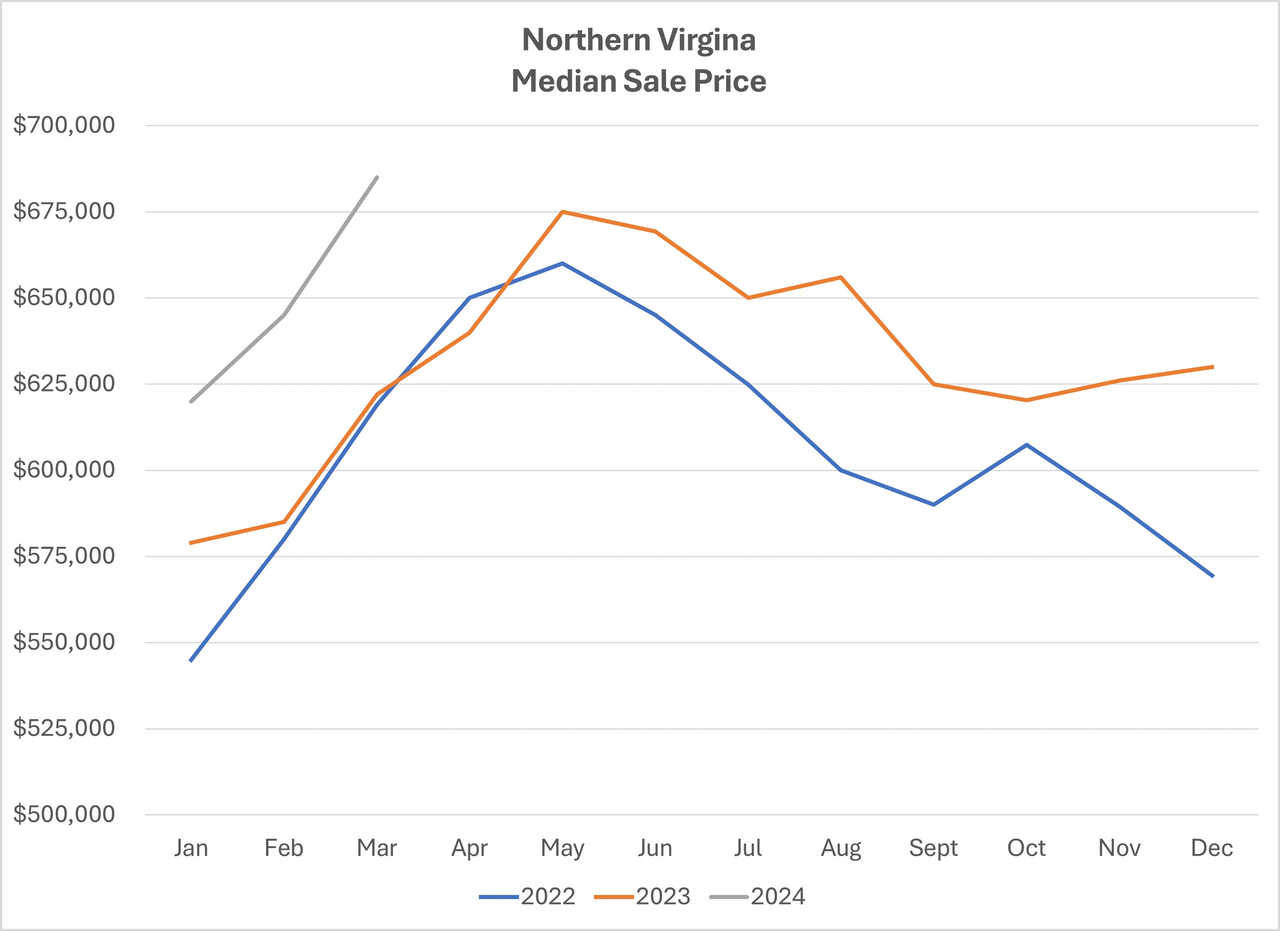
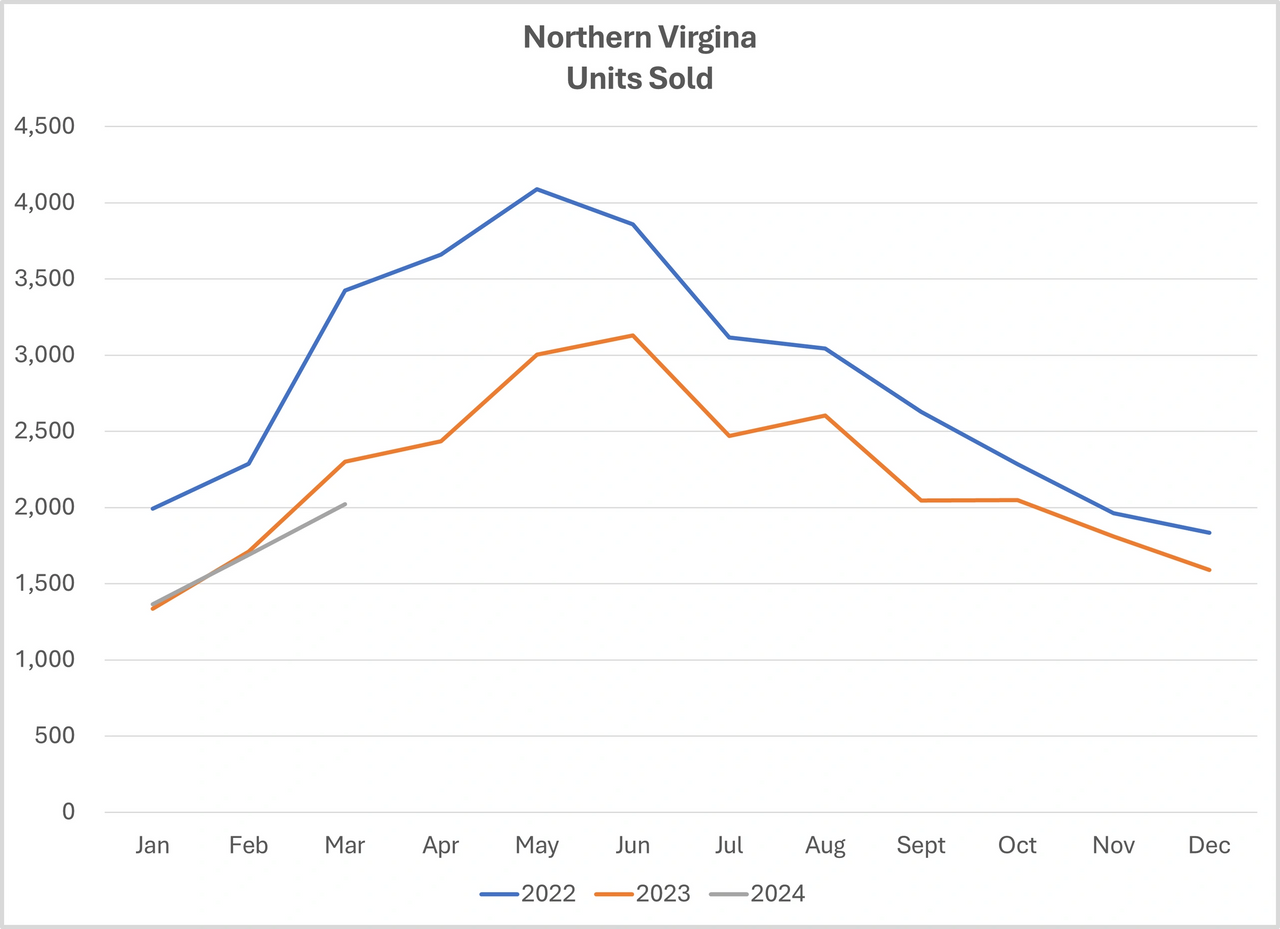
As you will see below, I have put together two charts to share with you this month. Both represent all residentials sales within Northern Virginia (Arlington, Alexandria, Fairfax, Loudoun, and Prince William Counties and their jurisdictions) since January 2022. I find this information useful to get a sense for trends, although it is not a substitute for hyper-local data.
The first chart tracks the median sale price. Apart from last spring, sale prices in 2023 were higher than 2022. So far this year, prices are even higher. What this chart does not show is the variance between the list price, contract price, final sale price, or concessions. Nor does this chart note the number of days on the market. These are all important considerations when pricing your home or making an offer. The chart simply reflects whether final sale prices throughout our region are higher or lower than in prior months and years.
The second chart displays the number of residential sales. These numbers are transactions closed per month. Most of these sales were under contract 30-45 days prior to closing. Prior to being under contract, they were active on the market for a few days to a few weeks. For instance, many of the 2,023 closings this March were on the market shortly into the new year. We see the amount of sales increase through the spring as buyers become more active. The people closing on their home in the first quarter were likely shopping for that home in the winter. This is often why I often suggest going on the market in the new year.
When I am asked about the state of the market, I briefly consider the trends in these charts. However, the answer is relative to where you live, the circumstance of the sale, the condition of the home, your timeline, and recent sales of like homes within your neighborhood. These are all factors not accounted for in general data and in online algorithms.
The National Association of Realtors (NAR) settlement received preliminary approval. Once fully approved, brokerages and Multiple Listing Services (MLSs) have 120 days to implement changes. One of the terms of the settlement is the requirement of a buyer representation agreement. This has been a requirement in Virginia for 12 years so this will not be an adjustment in our market as it is for many others. The second requirement will be to remove any buyer agency compensation from the MLS and any syndicated services (i.e. Zillow, Realtor.com, ShowingTime). Ironically, there was a Department of Justice (DOJ) suit in 2020 requiring full transparency of all broker fees paid within a transaction. We, practitioners, are just as curious as everyone else to see how these suits will change the home purchase and sale process, if at all.
I have been participating in a real estate class these last few days where there is no shortage of opinion or speculation. Many of my thoughts seem to be in the minority, however there is one part of the suit I believe is severely misunderstood. There seems to be a misconception Realtors have caused the increase in home prices. Home prices are a result of market conditions, just as the cost of milk and gas. Prices remain high until the consumers decide they can no longer afford a product and demand diminishes. Homes are going under contract within days with few or no contingencies. That would not occur if there was no demand for homes, or buyers could not meet the terms of their offers. Our suggestion for a list price reflects what is happening in the market. If we suggested anything less, we would not be doing our job for sellers, which is to maximize their net proceeds.
I would love to know your thoughts! Drop me a line to continue the discussion or if you would like data for your neighborhood.
